Visualizing Data

I have trouble understanding numbers, however visual images make sense to me.
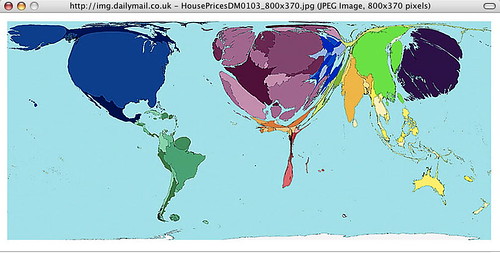
This shows house prices around the world, and I “get” it.

Check out the Daily Mail link to see how the following are spread out over the world: alcohol consumption, HIV prevalence, house prices, military spending, war and death, toy imports, toy exports, the wealth of nations in 1500, and the wealth of nations in 2002.

Geography and political science teachers should be using this kind of visualization, IMHO, so students who are visual can understand even if they are numbers-blind.

VoiceThreads

VoiceThreads is a beta application that looks like a lot of fun; it’s very easy and free. You use photos or other images, upload them, and use your computer’s microphone to add narration or other audio, or, if you don’t have, or don’t want to use a sound recording, you can simply type copy. Then people can comment, by voice or text, on your VoiceThreads, or you can limit who comments and who sees/hears the comment when. For more information, see my EduSpaces blog on it – http://eduspaces.net/vinall/weblog/189270.html

Understanding Web 2.0 and Business

Meet Charlie – Enterprise 2.0 is a slide show that shows where Web 2.0 is taking business. I’ve hesitated adding it to my blog because it is filled with misused apostrophes. (Please see Lynn Truss’s Eats, Shoots and Leaves for a detailed explanation of what I’m complaining about!)

However,Scott Gavin’s slide show, posted on SlideShare – http://www.slideshare.net/slgavin/meet-charlie-what-is-enterprise20 – provides an excellent description of where the business world is going, because of the web, as well as demonstrating how a PowerPoint can communicate effectively even without audio.

Enjoy – and learn!

Top 10 Tools, or What Other Educators are Using

I stumbled across Top 10 Tools yesterday, and found it a rich resource for web tools I could using in my teaching, learning and playing on the web. I sent in my own choices:


Check out my full list – http://www.c4lpt.co.uk/recommended/joanvinallcox.html
and find the riches in the collection of lists – http://www.c4lpt.co.uk/recommended/index.html

Thanks to Jane Hart and the Centre for Learning & Performance Technologies

Another Brain Backup – Backpack

I have been using the free version of Backpack for years. It’s especially handy for reminders, where I can set up a reminder to be emailed to me regularly. For example, I get a monthly reminder to check my bank account so that an automatic monthly withdrawal won’t cause me to be overdrawn. I get my monthly reminder in my inbox, and I haven’t had to worry about forgetting since I started using Backpack.

Now it has some new stuff making it even more interesting and useful –
Backpack
http://www.backpackit.com/tour

This is a remarkably versatile and easy-to-use application, and I suggest you add it to your Bookmarks Toolbar, and make it part of your personal learning/work environment, i.e. keep it always handy!

I’m still playing with Jott, which I posted about yesterday, and have found some problems with it, which I’ll cover when I get a message back from them.

Jott – Another Fun Application

My friend, Bob Collings, sent me a link to Jott a new application still in Beta, that is very interesting. You phone their number, tell them who you want to leave a message for, including yourself, speak, and Jott emails your message to you or any of the contacts you’ve named. It is absolutely simple and requires no technical knowledge at all!


It’s good for reminders, to do lists, and recording ideas, as well as messages. I’m going to play with it and see how it works for me.

Mapping Wikipedia

Teachers who want a way of introducing their students to a new topic may find it useful to use WikiMindMap to create a mindmap to introduce the subject, and as a quick way of getting basic resources into the hands of students. Mindmaps are especially useful for visual thinkers and those starting to research an area. John Dewey is one of the most important writers on teaching and learning, in my opinion, so I put his name into the search box, made sure that I was using the English Wikipedia, and got this –

Under “Select a Wiki”, make sure you select “en.Wikipedia.org”; the default is “de.Wikipedia.org”, which finds German results. The green circling arrows are direct links, and the plus signs can be opened out for further links. At this point WikiMindMap is in beta.

I had a lot of fun seeing what I could find through it.

via Tris Hussey’s A View from the Isle

Canada and the Web

I’m Canadian, and I’m pleasantly surprised to see the Canadian stats and apps:


from the Read/Write Web:

Canadians use the Internet more than anyone in the world. According to comScore, Canadians spend on average 39.6 hours per month on the Internet, followed by Israel at 37.4 and South Korea at 34, while the USA is in 8th position with 29.4. Canada also leads in online reach with 70% of households having Internet access. The average pages viewed per visitor is 3800 in Canada, while the U.K. is second at 3300. And at 67%, Canada has one of the highest broadband penetrations in the world, 21 points higher than the US. Finally, while Canada still lags in online advertising, with $28.05 per Internet user and the US with $71.43, ad spending is expected to grow 32% this year (Ernst&Young LLP). So Canada is a sophisticated, and growing, market for Web apps.

As in any other country, Canadians heavily use Google, Yahoo and other global services like ebay and craiglist; each of which has their own english and french canadian localized versions. In social networking, Facebook is the star app of the moment. For instance, Toronto has more than 650.000 facebook users, more than the combined facebook users in New York, Boston and Los Angeles.

So Canada is still a communications leader!